Conceptual
US Trade: a trade data intelligence dashboard
A concept dashboard that turns US and global trade data into readable overviews of exports, imports, industries, states and country comparisons.
- Type
- Web app
- Role
- Design research, UX, Wireframing, UI design
- By
- Masum Rana
US Trade is a concept for a dashboard that makes trade data readable for people who are not economists. It answers questions like “which states are exporting more this year?”, “which industries in Wisconsin are growing?” and “how does our trade with China compare to theirs with us?” in a few seconds each.
It was designed by Masum Rana, founder of Premium Design Company, as a design research project.
What was designed
Nine screens, all sharing the same filter bar (region, industry, country, time period) and the same compare action:
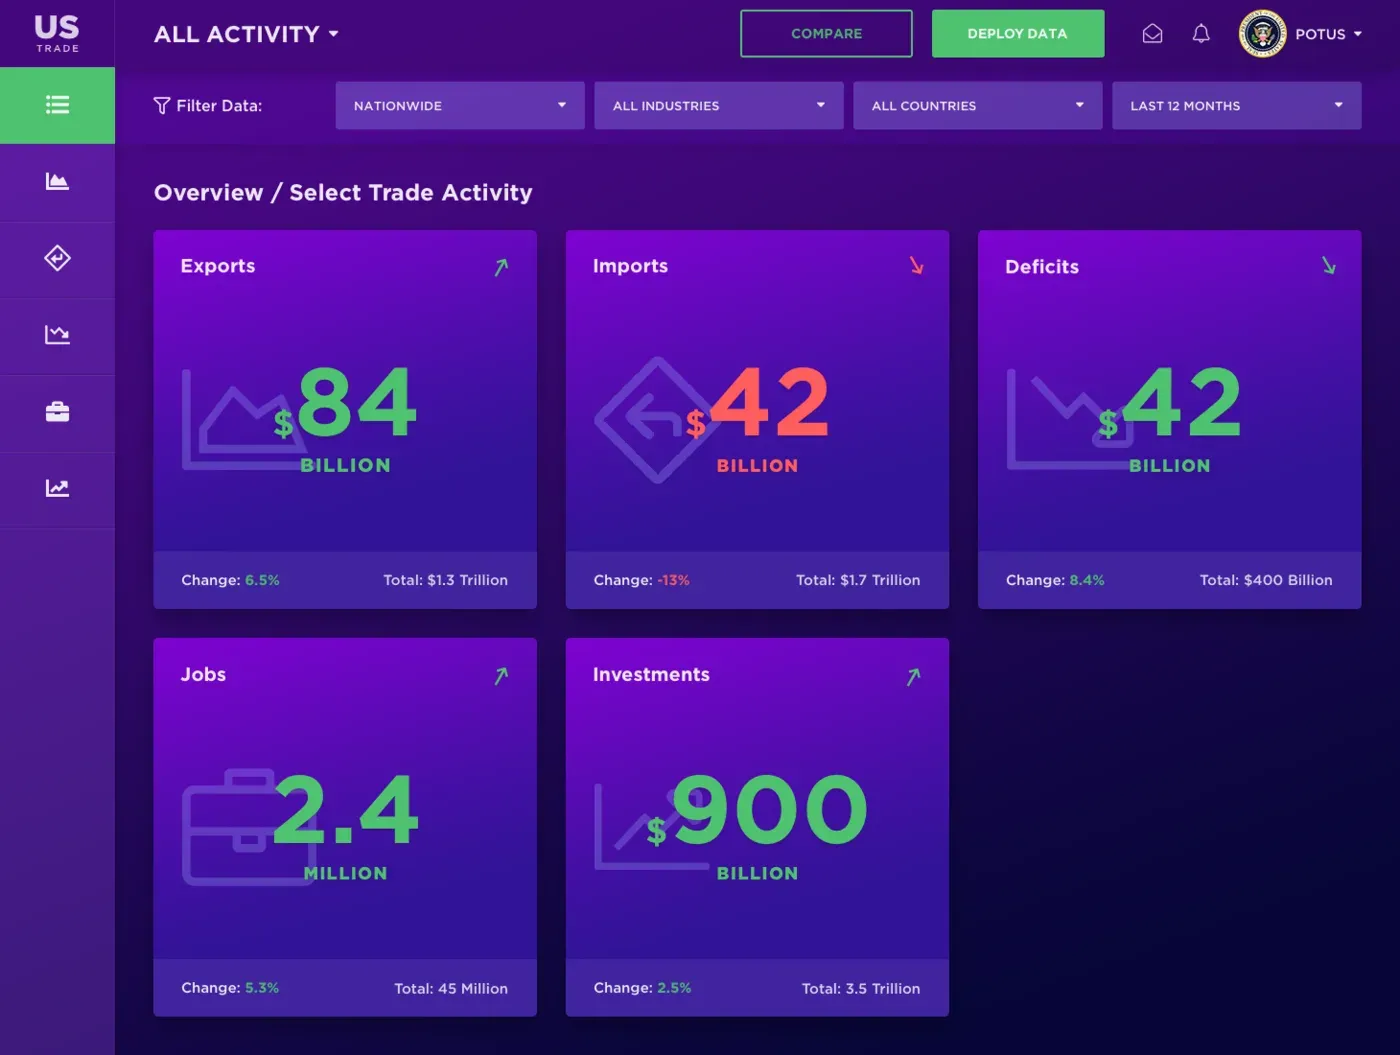
- National overview: five headline numbers (exports, imports, deficits, jobs, investments), each with its change and total.
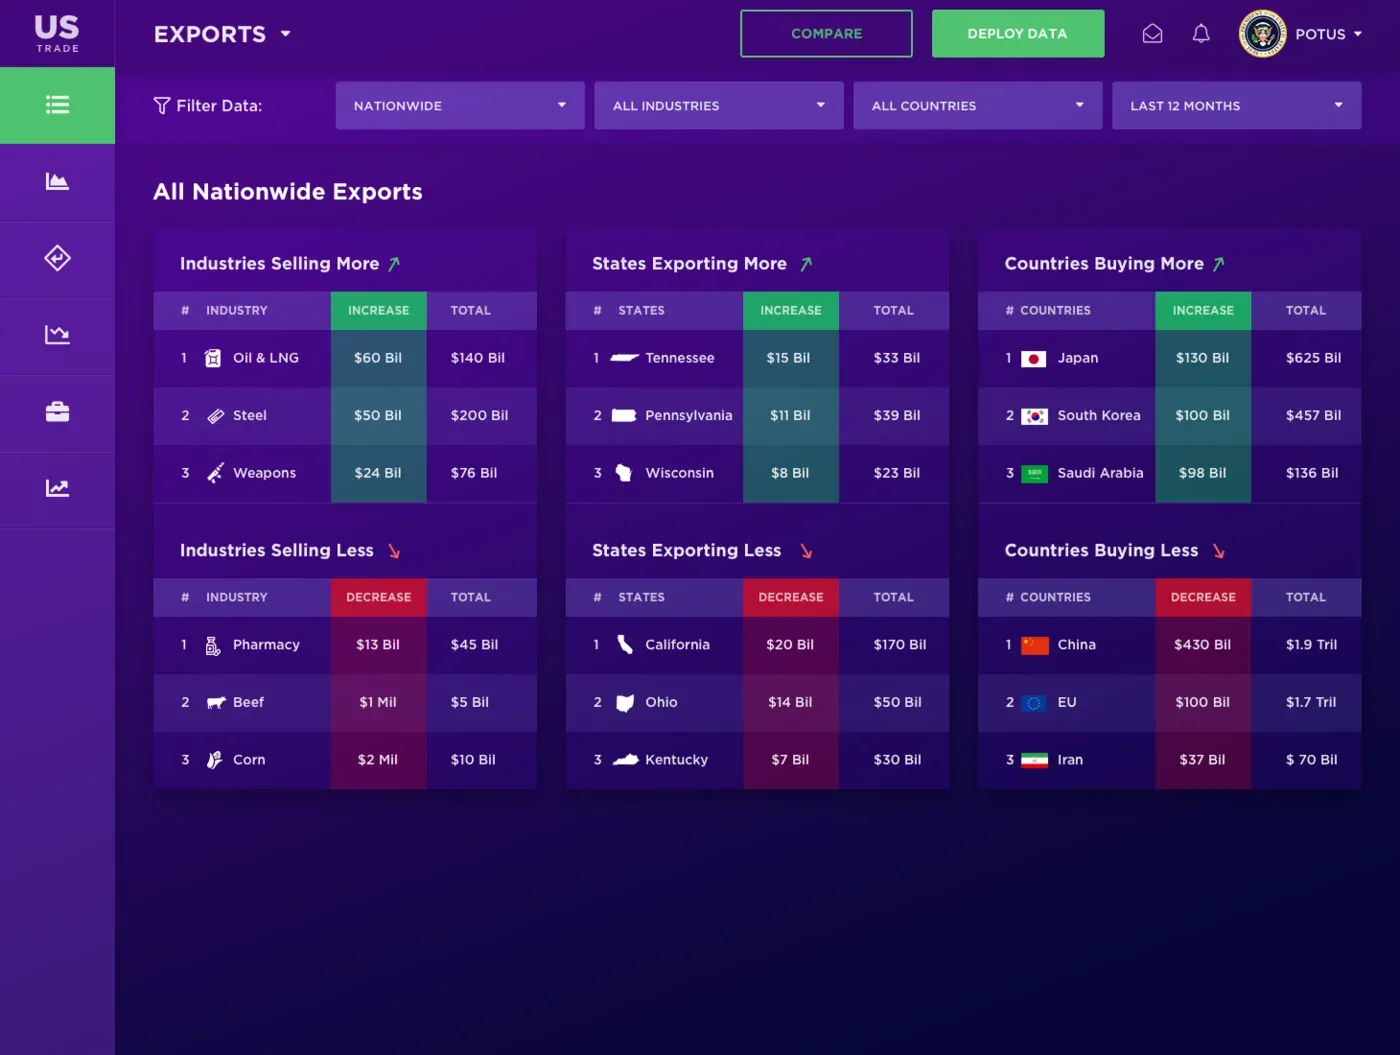
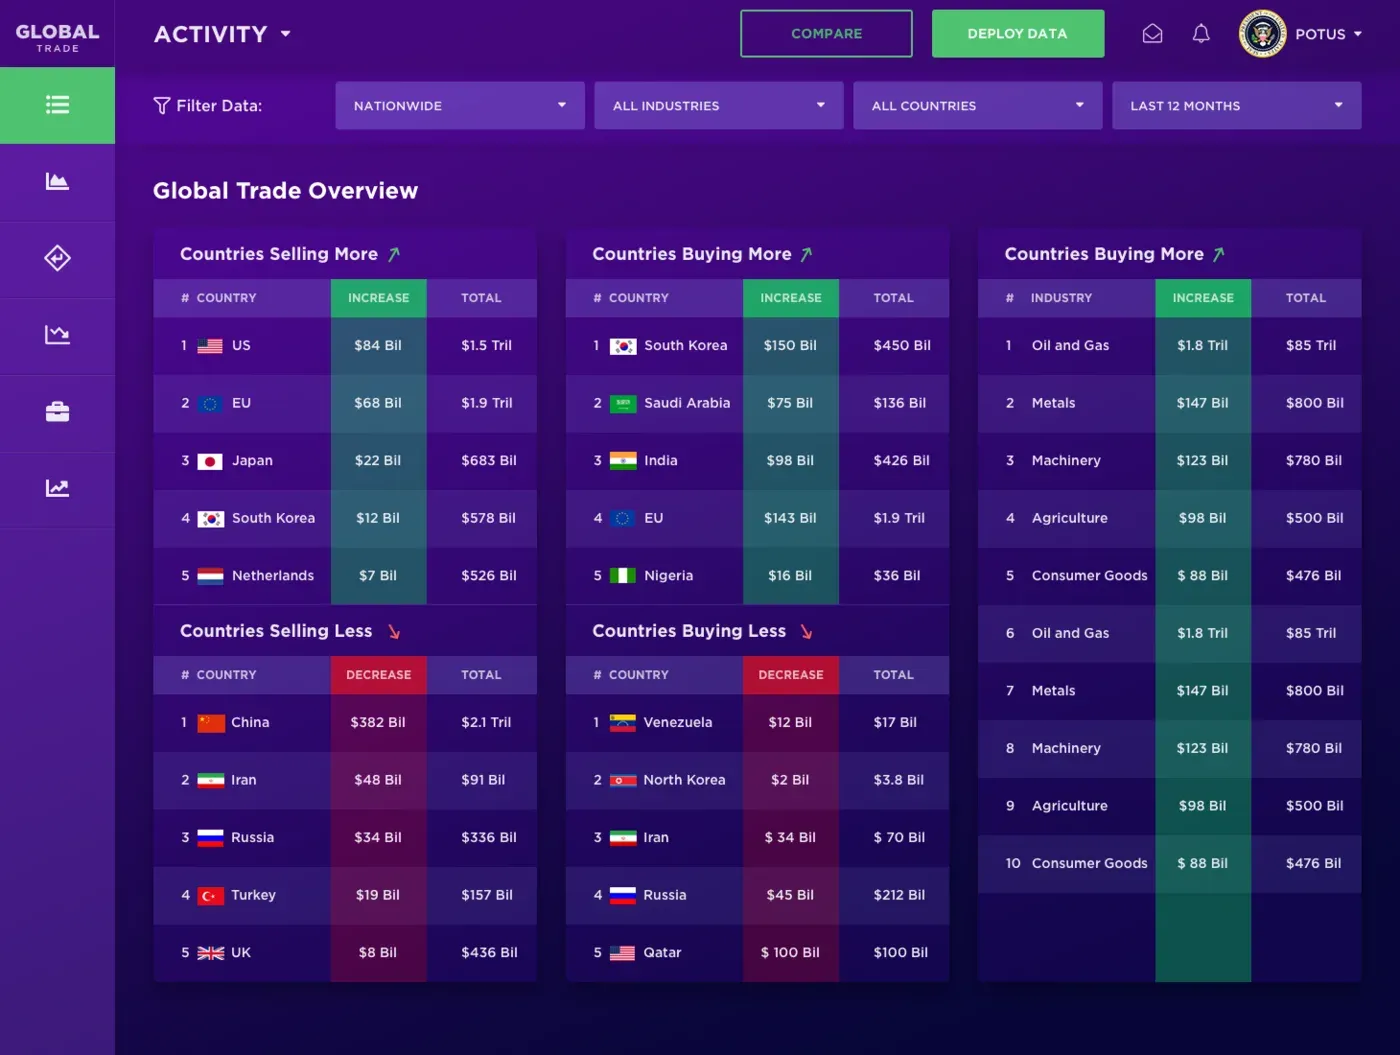
- Exports: industries, states and countries ranked by who is buying or selling more, and who less.
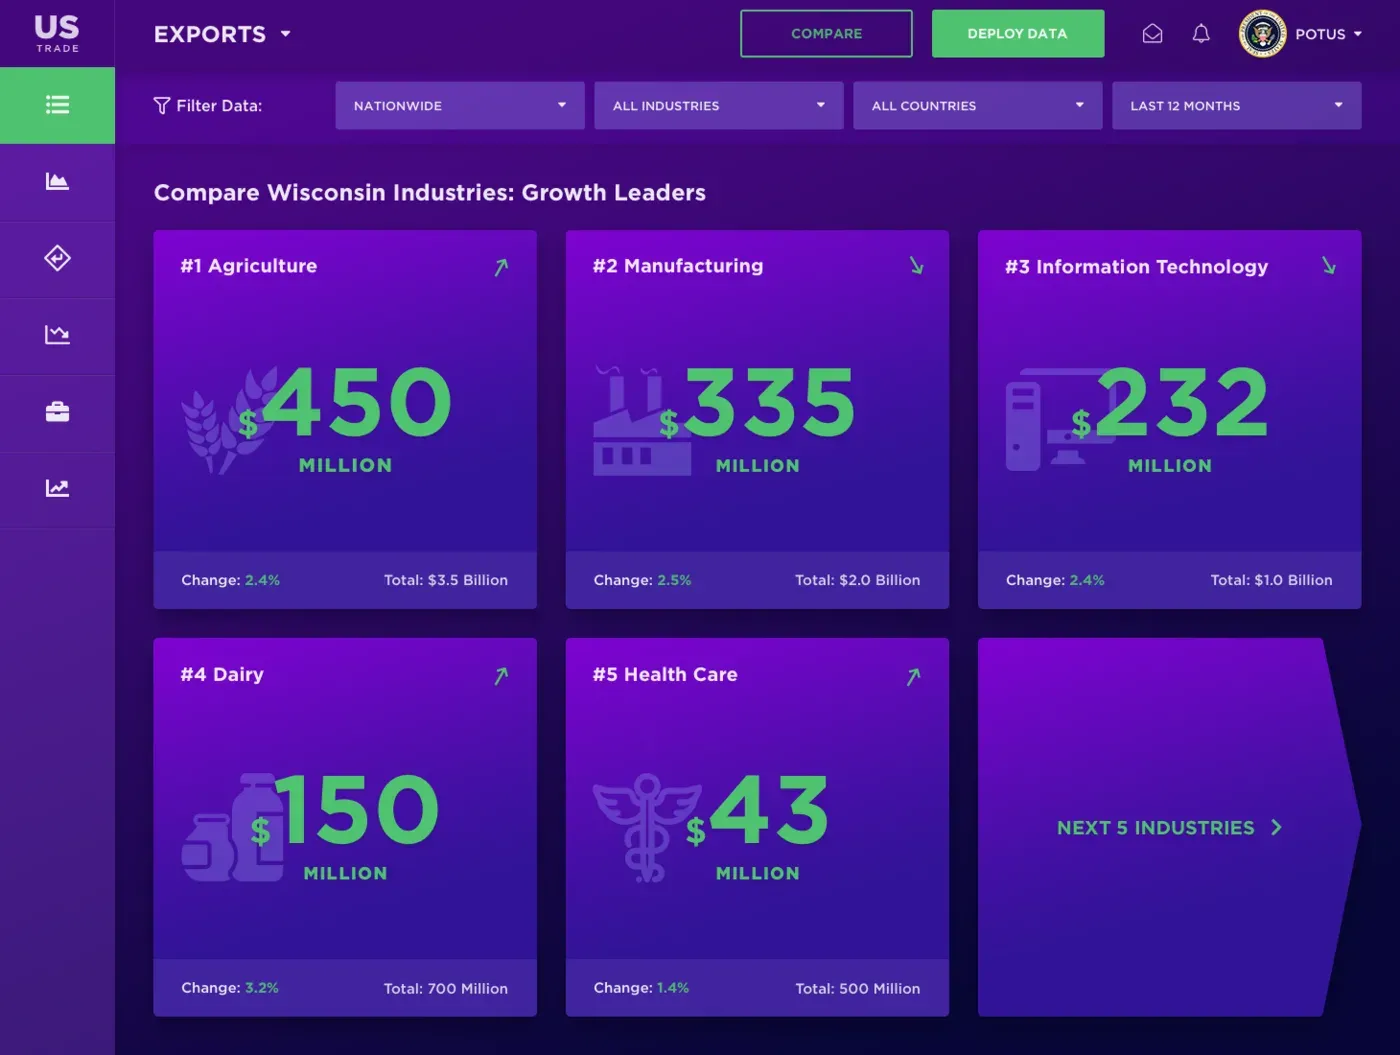
- State industries: one state’s top industries side by side, with their growth.
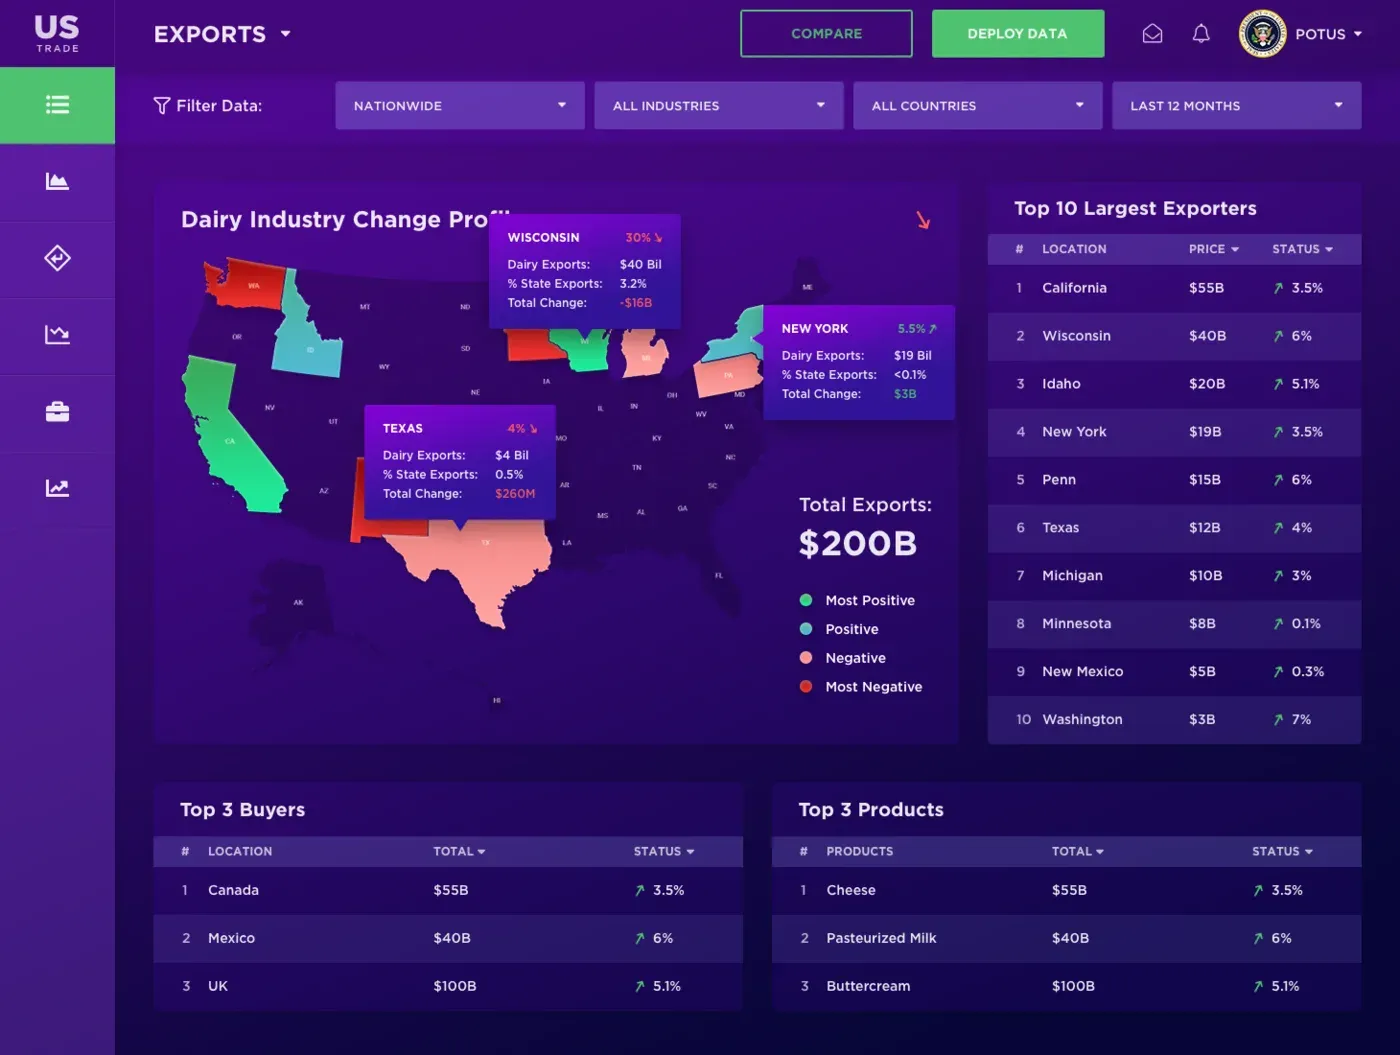
- Industry map: one industry, such as dairy, coloured across the US map, with the top exporters, buyers and products.
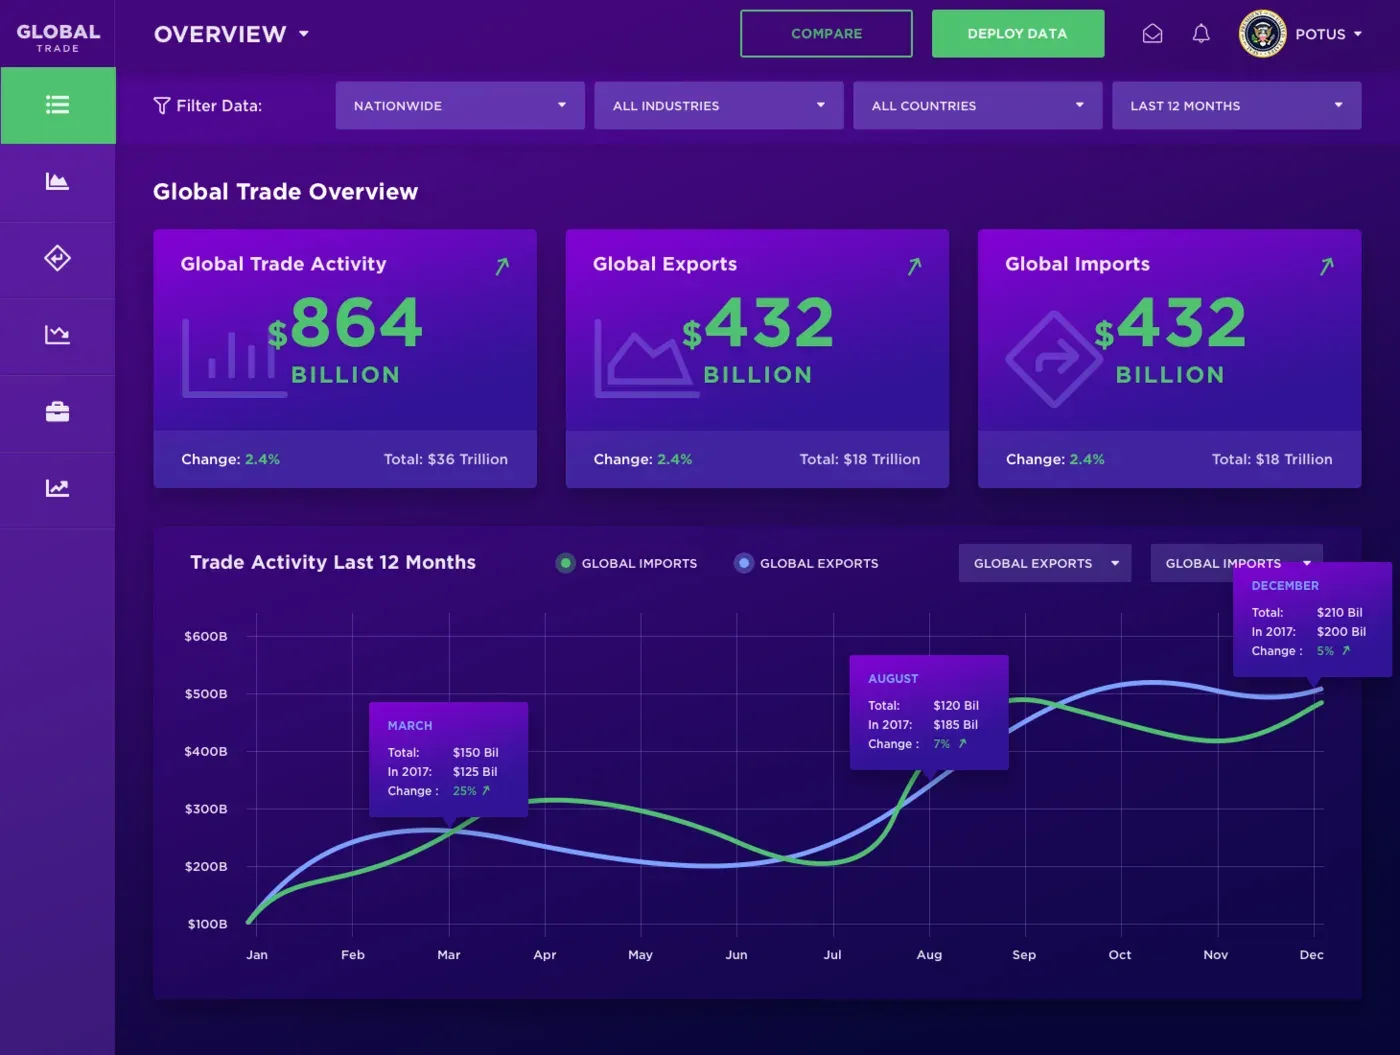
- Global overview and activity: the same ideas at world scale, with a 12-month chart.
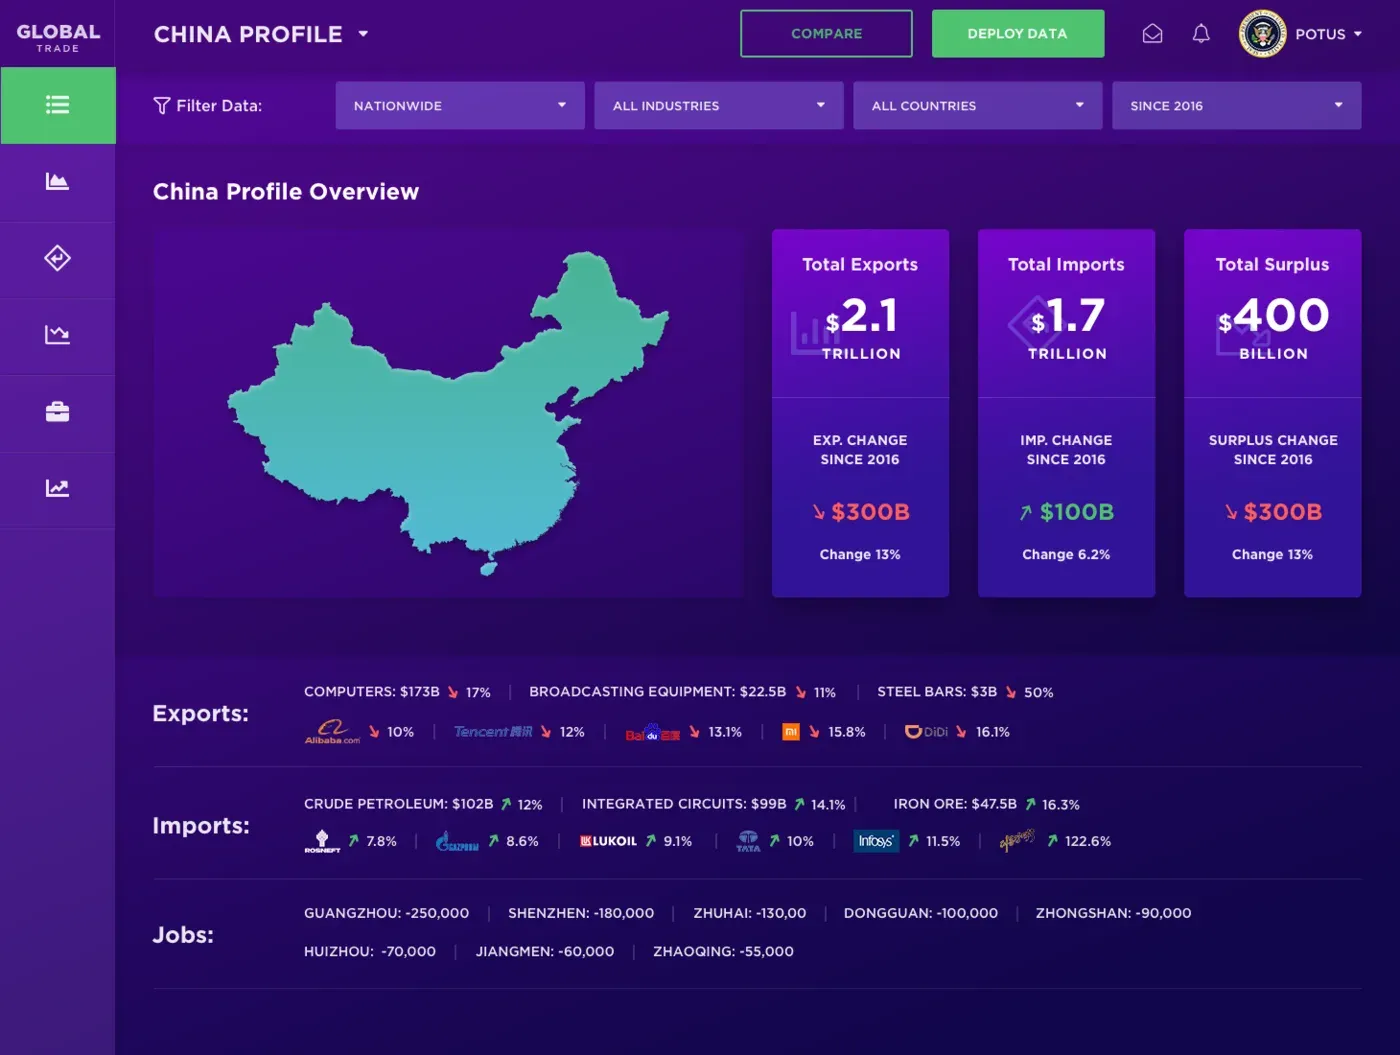
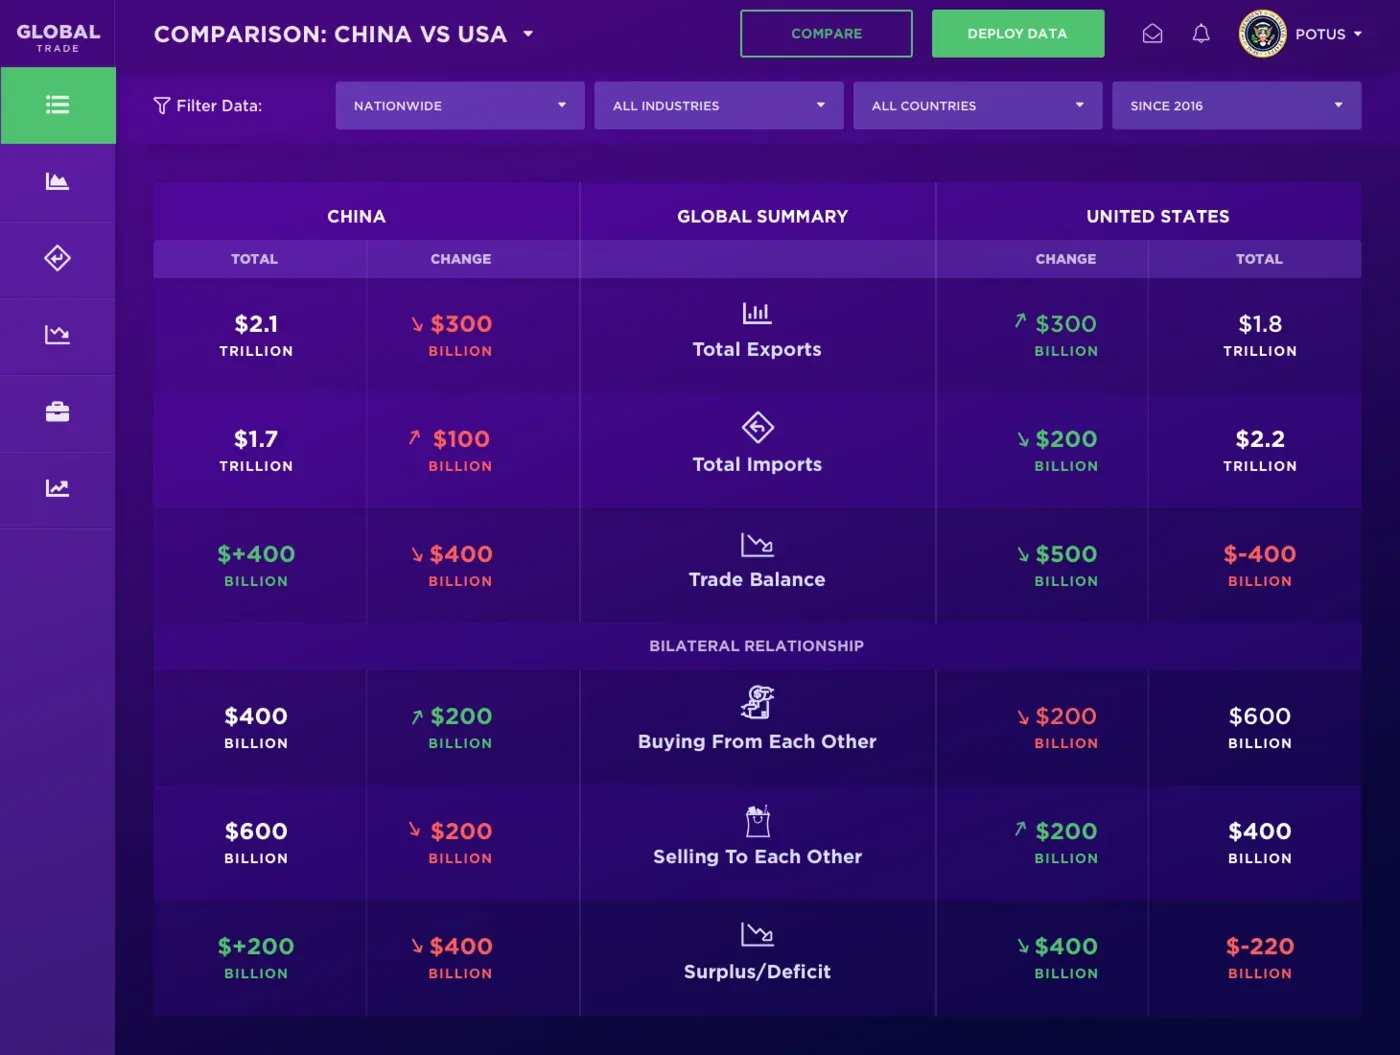
- Country profile and comparison: one country’s totals and top products, and two countries side by side on exports, imports and the balance between them.
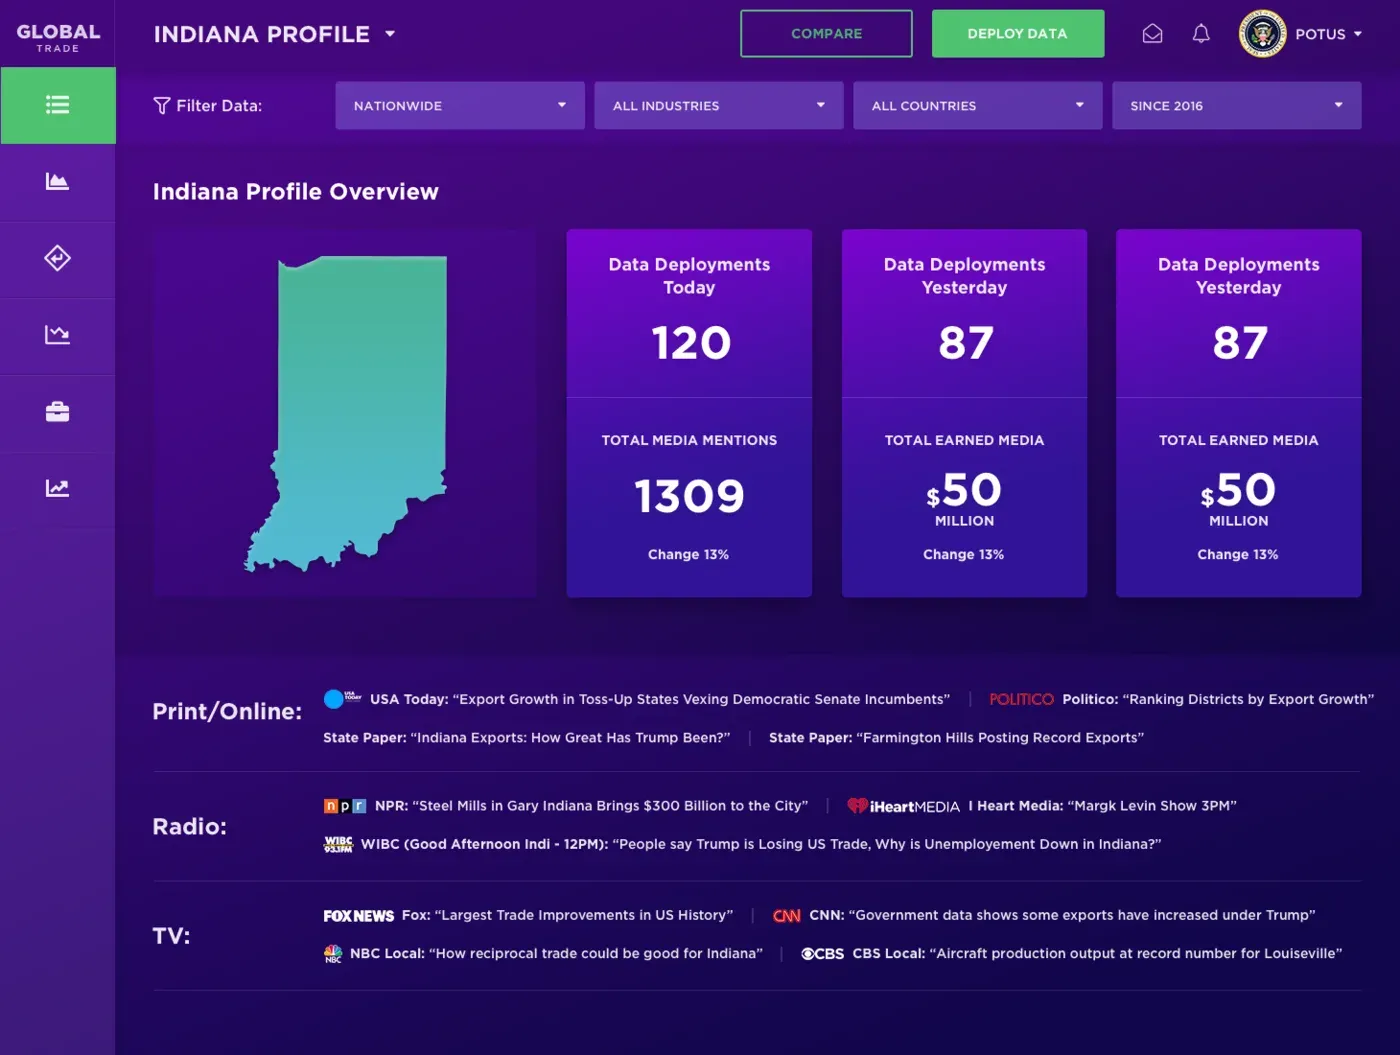
- State profile: trade figures next to how the media covered them, across print, radio and TV.
Design decisions
One big number per card. Each card leads with a single large figure and its direction of change. Detail is one level down, so the first glance always gives the answer.
Rankings split into “more” and “less”. Instead of one long sorted list, the ranking tables are split into who is growing and who is shrinking. That is the question people actually bring to trade data.
The same filters on every screen. Region, industry, country and period sit in the same place everywhere, so moving from the national view to one state’s dairy exports never means learning a new control.
Want something similar?
We design dashboards that turn complex data into quick answers. See our web design service or book a call.
Screens
Also published on Coroflot .
Next project
Supplyr →